Solana (SOL) has captured the attention of investors and analysts as its price charts form a distinctive falling wedge pattern. This technical formation, often seen as a potential trend reversal indicator, has stirred discussions about the future trajectory of SOL’s value.
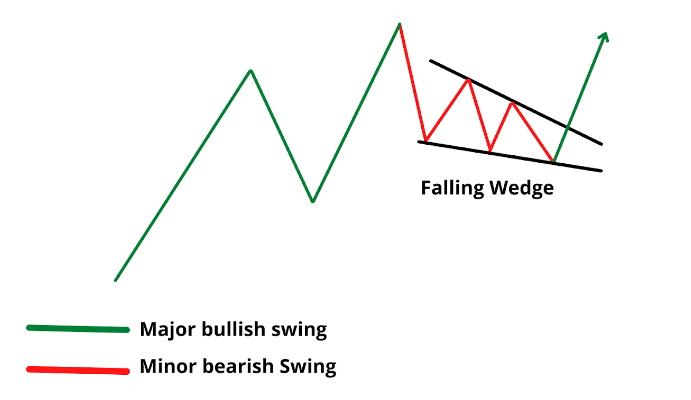
A falling wedge pattern is a common chart pattern in technical analysis, characterized by a contracting range between two trendlines that slope in the same direction. The upper trendline, representing the declining highs, converges with the lower trendline, formed by the decreasing lows.
This pattern suggests a potential bullish reversal, as the price reaches a point of consolidation, leading to an eventual breakout to the upside.
Image: Bybit Learn
Solana Vies For Bullish Upswing
As SOL’s price continues to exhibit this falling wedge pattern, analysts are eyeing a potential bullish upswing in the near future. The recent retest of the lower trendline has intensified demand pressures, potentially setting the stage for a breakout.
Price analysis projections point towards a potential recovery that could take SOL’s value towards the overhead trendline or even the $21.55 mark.
However, the validity of this pattern relies on the integrity of the two trendlines. While the falling wedge pattern suggests a bullish outlook, a failure to maintain these trendlines could lead to further downward movement.
Investors and traders remain cautious, recognizing that as long as the pattern holds, there is a risk of SOL’s value prolonging its descent and potentially reaching the $16 mark.
Recent market data from CoinGecko paints a mixed picture, with SOL’s price at $20.32, reflecting a 2.8% decline over the last 24 hours and a 5.2% slump over the past seven days. These fluctuations highlight the inherent volatility in the